
Perimeter security is the set of physical and electronic measures that detect unauthorized activity at a property boundary, verify whether the activity is a real threat, and intervene to stop it before loss occurs. The category covers five delivery models:
- Monitored alarm systems
- AI camera platforms
- On-site and patrol security guards
- AI-enabled autonomous deterrence
- Remote video monitoring with live operator intervention.
Each model handles detection well. They differ in what happens next.
Unstaffed commercial properties face the widest gap between detection and intervention. Quick-service restaurants, big-box retailers, car washes, and other multi-site commercial operators run properties where no one is on site during the highest-risk hours. Most commercial burglaries are over in eight to ten minutes.¹ For unverified alarms, only one to five percent are triggered by an actual crime, which is why most cities deprioritize them and many no longer respond at all.¹ A camera that records the breach produces evidence, not a stopped incident. A guard on rotation is rarely at the right location. A passive alarm sends a signal, then waits.
The core problem this guide addresses
Recording is not deterrence. A camera that captures a clear image of someone breaking through a fence at 2 AM has done its job as a recording device and failed completely as a security measure. The distinction between documenting a loss and preventing one is the single most important idea in perimeter security, and the one the industry is least honest about.
What closes the gap is verification and intervention. Systems that combine detection at the perimeter with verified, real-time response on the property itself produce a fundamentally different outcome than systems that detect and record. The data from a recent deployment across 29 retail locations during Q4 2025 illustrates the difference: 23,810 perimeter activations, 96.1% resolved through automated deterrence, and exactly one event requiring police dispatch.²
23,810 activations. 96.1% automated resolution. 1 police dispatch.
Q4 2025 deployment across 29 retail locations with AI-enabled autonomous perimeter deterrence.
Source: Interface Systems, 2026 Retail Loss Prevention Benchmark Report ²
Why Some Perimeter Security Solutions Fail
A failure mode is the specific way a security approach breaks down in practice, even when it works the way it was sold. Most unstaffed commercial properties run one of four perimeter security models, and each one fails for a reason worth understanding before any vendor conversation begins.
Why Alarm-Only Systems Fail at Unstaffed Properties
A perimeter alarm detects intrusion through door contacts, motion sensors, glass-break detectors, or fence sensors. When something trips, the panel signals a central station, which calls the property’s contact list and, if no one cancels the alert, dispatches police.
The problem is what happens at the dispatch center. Only one to five percent of burglar alarms are triggered by an actual crime,¹ and police departments have responded by deprioritizing or refusing to respond to unverified alarms entirely. Salt Lake City cut its police responses to alarm calls by 95 percent after adopting verified response. Milwaukee went from 30,000 alarm dispatches per year to roughly 800.¹
For a multi-site operator, this means a perimeter alarm at a tire yard in Phoenix or an auto parts store in Cleveland is being treated, quietly and routinely, as a low-priority call. The signal goes through. The log gets written. Officers may arrive an hour later or not at all, by which point the burglars have left the scene of crime with stolen goods.
Diagnostic question: Can the loss prevention team produce a number for how many of last year’s alarm activations resulted in an actual police response? If the answer is “we don’t track that,” the alarm-only model has been generating signals, not interventions, for years.
Some mobile trailer providers now bundle command-center monitoring with automated deterrence. Where live monitoring is included, the trailer functions as a mobile version of a remote video monitoring service rather than a standalone deterrence device. The three failure modes above apply to unmonitored or automated-only deployments, which remain the majority of what multi-site operators deploy.
Why Camera-Only Deployments Produce Evidence, Not Prevention
A camera-only deployment puts fixed cameras or AI-enabled analytics across the perimeter, usually with cloud storage and motion-triggered alerts to a property manager’s phone or a Video Management Systems dashboard.
This model produces excellent evidence and almost no stopped incidents. The camera sees the breach clearly. The recording is timestamped. The phone alert may even arrive within seconds. None of this stops what is happening on the property. By the time someone wakes up, watches the clip, decides whether the figure on screen is a real intruder or a delivery driver, and calls the police, the burglary is over.
AI analytics tighten the detection window but cannot close the intervention gap. Better algorithms tell the property manager more quickly about something they still cannot personally stop from another time zone.
Diagnostic question: Look at twelve months of footage and twelve months of loss numbers side by side. The footage will be clean. The losses will be unchanged. The category name for what the camera platform is delivering is post-incident evidence, not perimeter security.
Why Security Guards Don’t Solve Multi-Site Perimeter Risk
The guard-only model places a uniformed officer on the property, either continuously during high-risk hours or, much more commonly for multi-site commercial operators, on a roving patrol covering several sites in a single shift.
Both versions break down for different reasons. The roving model fails on coverage math. A guard moving through eight sites on a six-hour overnight shift spends roughly 45 minutes at each property, including drive time. Anyone watching the property from across the street for a single afternoon learns the rotation. The breach happens during the ninety percent of the night the guard is at one of the other seven sites.
The continuous on-site model fails for the opposite reason. It works, but it is wildly expensive. A guard at $35 to $45 per hour, running continuously across nights and weekends, costs $90,000 to $130,000 per site per year. Across a 200-location chain, that is a $20 million line on the security budget that no CFO will approve, and the math gets worse when you consider that turnover in the commercial guarding sector runs above 100 percent annually. The guard you trained on your protocols in January is rarely the guard standing at your dock in October.
Diagnostic question: How many incidents did your guards prevent last quarter? The data exists in fragments at each site, on each shift, with each subcontracted firm, but no one has ever assembled it into a single number.
Why Mobile Surveillance Trailers Fail as a Permanent Solution
A mobile surveillance trailer is a self-contained tower with cameras, floodlights, speakers, and sometimes AI analytics, powered by solar panels or a generator. Trailers earn their place at construction sites, temporary lots, and properties that lack power, network, or fixed mounting points. As a permanent perimeter solution for an operating commercial property, they fail in three connected ways.
Deterrence decays: The flashing strobe and the recorded warning that cause an opportunistic intruder to leave on day one become background noise by week six. Operators routinely report repeat incidents at the same site within sixty to ninety days of trailer deployment, because the people testing the property have learned the warning repeats without consequence.
Coverage is single-zone: A typical trailer carries four to eight cameras with an effective range of one hundred to three hundred feet. A tire yard, a car wash lot, or the rear delivery dock of a big-box store has a perimeter geometry that needs five to ten coverage zones. One trailer covers one of them, and intruders quickly learn which.
The verification problem persists: Most trailer programs run on automated voice-down loops and motion-triggered recording rather than live operators. Where monitoring exists, it is usually shared across hundreds of trailers per operator, which queues real events behind every false trigger in the network.
The pattern operators see most often: a trailer deployed in response to a specific incident, useful for thirty to sixty days, then continuing to record an empty lot for two years while the loss pattern quietly shifts to the other side of the property.
Some mobile trailer providers now bundle command-center monitoring with automated deterrence. Where live monitoring is included, the trailer functions as a mobile version of a remote video monitoring service rather than a standalone deterrence device. The three failure modes above apply to unmonitored or automated-only deployments, which remain the majority of what multi-site operators deploy.
The Pattern Across All Four Models
Each of these models does the first part of the job. The alarm detects. The camera records. The guard observes. The trailer broadcasts. None of them, on their own, verifies what is happening and intervenes before the loss occurs. That gap, between detection and intervention, is where commercial perimeter loss actually happens, and it is what the rest of this guide is about.
A Better Framework for Perimeter Security: Detect, Verify, Intervene
The security industry has spent two decades teaching commercial buyers to think about perimeter protection in terms of three D’s: deter, detect, delay. The framing comes from physical security doctrine developed for critical infrastructure and military sites, and it made sense in that context. For an unstaffed commercial property running on multi-site economics, it leaves out the part that actually determines whether a breach turns into a loss.
A more useful framework has three steps: detect, verify, and intervene.
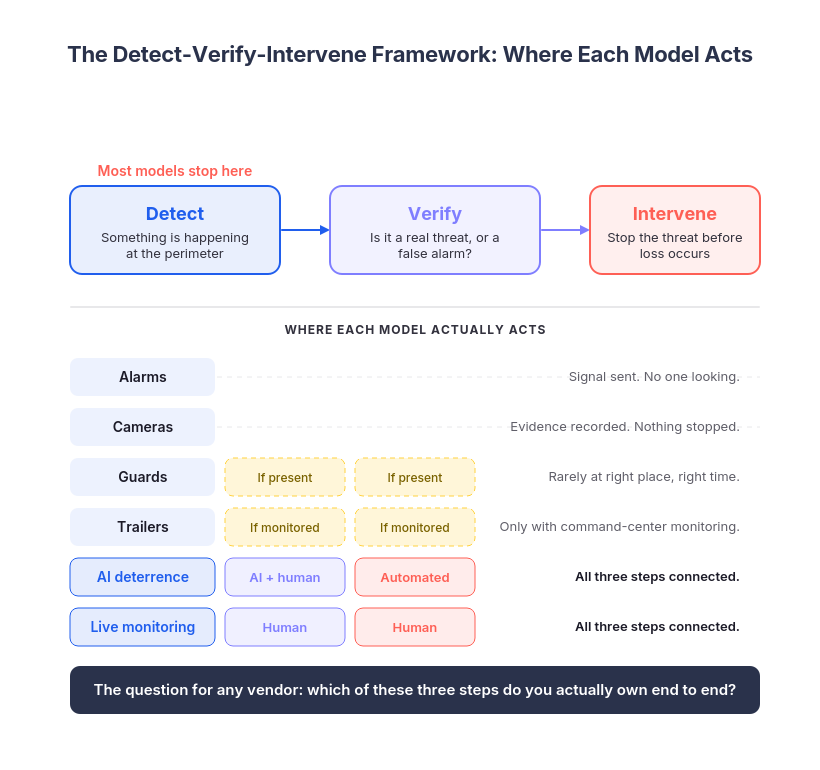
Detection is the moment a system or person becomes aware that something is happening at the perimeter. A motion sensor trips. A camera analytic flags a person crossing a virtual line. A guard sees movement near the fence. Detection is necessary, and the security industry has gotten remarkably good at it over the past decade. Modern AI analytics can distinguish a person from a deer, a delivery van from a passenger car, and a parked vehicle from one that has been idling for forty minutes.
But detection on its own answers only one question: something is happening. It does not answer the two questions that matter next.
Verification is the determination of whether what has been detected is a real threat. A figure crossing the lot at 2 AM might be an intruder, a maintenance worker the operator forgot to schedule, an employee retrieving a phone, or a homeless person looking for shelter. Each of these requires a different response. Verification is the step where a human, or in some cases a well-trained AI system supervised by a human, looks at the situation and decides.
This is the step the alarm-only and camera-only models skip. The alarm signals without verifying. The camera records without verifying. The dispatch center treats the unverified signal as a probability problem and, knowing that ninety-five to ninety-nine percent of alarms are false, deprioritizes the call. The whole system is engineered around the absence of verification.
Intervention is the action that stops the threat from becoming a loss. Intervention can take several forms. A live operator can speak to the intruder over an on-site speaker, identifying themselves and the property and announcing that police have been dispatched. An automated voice-down can deliver the same message at the moment of detection, before any human is involved. A guard, if one is on the property, can approach the intruder. Police, if they have been called on a verified alarm, can respond as a priority dispatch rather than a deprioritized one.
Intervention is what closes the loop. Without it, every previous step in the chain produces information instead of outcomes.
Six Perimeter Security Solutions Compared: Capability, Gaps, Cost
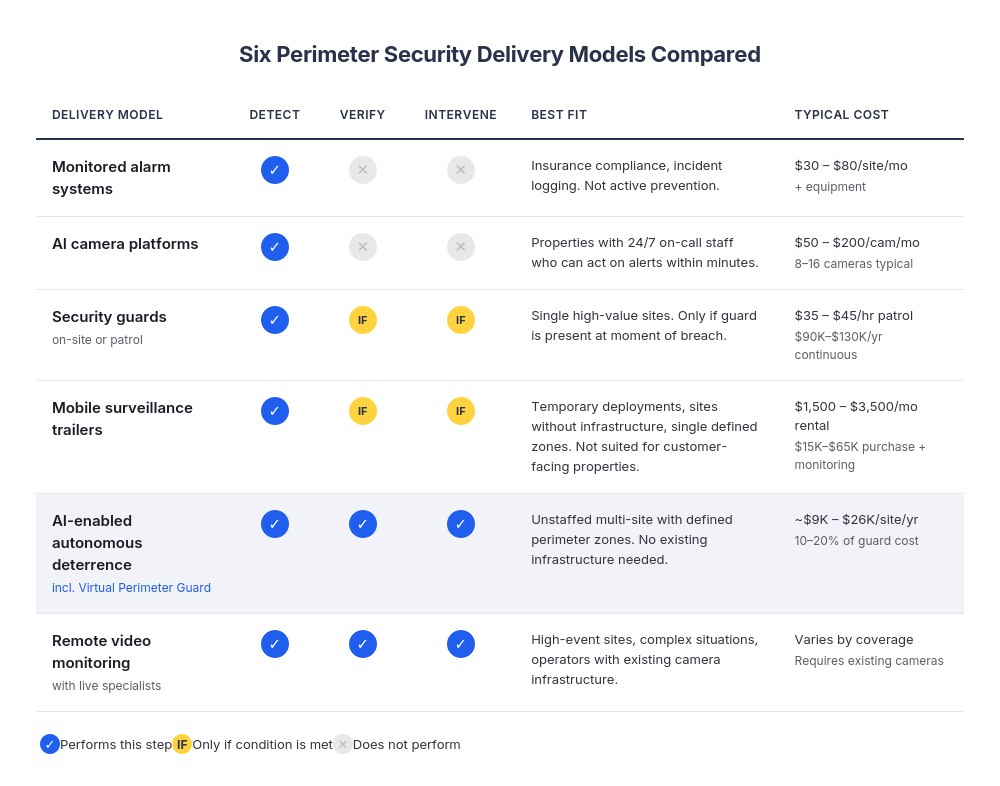
Once the detect-verify-intervene framework is in place, comparing perimeter security options becomes a matter of working through each model and asking where it acts, where it hands off, and what the operator actually gets for the spend. The five delivery models below cover roughly ninety-five percent of what unstaffed commercial properties deploy today.
1. Monitored Alarm Systems
A perimeter alarm panel connects to a central station that receives signals, runs them through call trees, and dispatches police on unverified alerts.
What it does well: Detection is reliable across sensor types, the cost per site is low, and the technology has been refined over forty years of deployment.
Where it breaks down: Verification is absent by design. The central station is not looking at the property, only at the signal. Dispatch centers in most U.S. cities have responded to the false-alarm rate by deprioritizing or ignoring unverified alerts.¹
Best fit: Properties where the primary purpose of the alarm is insurance compliance or after-the-fact incident logging, rather than active loss prevention.
Typical cost: $30 to $80 per site per month for monitoring, plus equipment and installation.
2. AI Camera Platforms
A network of fixed cameras with on-device or cloud-based AI analytics that detect persons, vehicles, line crossings, or loitering, with motion-triggered alerts to a property contact or Video Management Systems dashboard.
What it does well: Detection is increasingly precise. Modern analytics filter out animals, weather, and lighting changes, which addresses the false-alarm problem at the detection layer rather than the dispatch layer. The platforms also produce excellent post-incident evidence.
Where it breaks down: Verification and intervention are not part of the platform. The alert reaches a property manager’s phone. What happens next depends entirely on whether that person is awake, available, and willing to call police on what they see.
Best fit: Properties where someone is on-call and ready to act on alerts within minutes, around the clock, every night of the year. For most multi-site operators, that role does not exist.
Typical cost: $50 to $200 per camera per month for cloud platforms with analytics, plus camera hardware. A typical commercial site runs eight to sixteen cameras.
3. Security Guards (On-Site or Patrol)
A uniformed officer either continuously on the property or rotating through several properties on a patrol route.
What it does well: When a guard is physically on the property at the moment of a breach, they handle all three steps at once. They detect, they verify by looking at the situation, and they intervene by approaching or by calling police on a confirmed crime in progress.
Where it breaks down: The moment-of-breach condition is rarely met. Patrol routes leave each property uncovered most of the time, and continuous coverage is cost-prohibitive at portfolio scale. Turnover and consistency add a second layer of operational risk.
Best fit: Single high-value sites where the cost of continuous coverage is justified, or short-term deployments where a visible human presence is the point.
Typical cost: $35 to $45 per hour for patrol. Continuous on-site coverage runs $90,000 to $130,000 per site per year.
4. Mobile Surveillance Trailers
5. AI-Enabled Autonomous Perimeter Deterrence
A self-contained perimeter unit that combines AI-driven detection, automated voice deterrence, on-site strobes, and cellular connectivity. The system identifies threats at the perimeter, issues escalating automated warnings on the property itself, and resolves the majority of activations without human involvement. Persistent threats that do not respond to automated deterrence escalate to a live intervention specialist who can deliver custom voice-down commands and coordinate law enforcement dispatch.
What it does well: All three steps in the detect-verify-intervene framework happen as a connected sequence, with AI handling the bulk of the work autonomously. Detection runs continuously. Automated voice-down handles initial intervention at the moment of detection, before any human is in the loop. Live specialists handle the smaller share of events that require sustained human judgment. Standalone design means deployment does not require integration with existing infrastructure.
Where it breaks down: Each unit covers a defined zone around its mounting position, so properties with sprawling or irregular perimeters may need multiple units. The AI model requires a calibration period after initial deployment, typically one to two weeks, during which false-positive rates are higher as the system learns normal activity patterns at the specific site. Automated voice-down is effective against opportunistic intruders but has diminishing returns against determined, repeat offenders who have studied the response pattern, which is why the live specialist escalation layer exists.
Best fit: Unstaffed commercial properties that need perimeter protection without the complexity of integrating into existing camera, network, or alarm infrastructure. Properties with defined perimeter zones, including parking lots, drive-thrus, fenced yards, and rear delivery areas, map well to standalone unit coverage.
Typical cost: Varies by vendor. Generally runs ten to twenty percent of the annual cost of a continuous on-site security guard, placing the range roughly between $9,000 and $26,000 per site per year for 24/7 autonomous coverage.
How Interface Delivers This Model: Virtual Perimeter Guard
Interface’s Virtual Perimeter Guard is an AI-enabled unit with onboard cameras, speakers, strobe lights, and built-in 5G connectivity that operates independently of existing site networks, cameras, or alarm panels. In a Q4 2025 deployment across 29 retail locations, the system logged 23,810 perimeter activations, resolved 96.1% through automated deterrence at three escalating stages, and required police dispatch for exactly one event.²
Schedule a free Perimeter Risk Review to get a property-level assessment, recommended deterrence zones, and a high-level rollout plan for your locations.
6. Remote Video Monitoring with Live Specialists
A network of cameras and on-site speakers connected to a central operations center where trained specialists watch, verify, and respond to detected events in real time. This model depends on integration with the property’s existing cameras and audio infrastructure, and on a continuously staffed operations center to handle every verification and intervention.
What it does well: Human verification on every event handles edge cases that AI-only systems may misread, including employees working late, vendors arriving early, ambiguous vehicle activity, and extended interactions with intruders that require sustained operator engagement. The human-in-the-loop model is also the most adaptable to complex or unusual situations: an operator can recognize context that no algorithm has been trained for, adjust their response in real time, and make nuanced judgment calls that improve outcomes. For properties with high event frequency, the investment in continuous human coverage is justified by the complexity of the situations the operators handle.
Where it breaks down: Because every event flows through a human operator, response time depends on operator availability and queue depth. Cost scales with operator coverage hours rather than with detection volume. The model also requires existing camera coverage of the perimeter, on-site audio hardware, and a reliable network connection at the property.
Best fit: Properties with high event frequency, complex situations that benefit from sustained human judgment, or operators who already have camera infrastructure in place and want to add a live monitoring layer behind it. Also a strong fit for operators who prefer a human decision on every event rather than relying on AI-first automation.
Typical cost: Varies significantly by hours of coverage, number of monitored cameras, and operations center staffing model. Typically less expensive than continuous on-site guards and more expensive than autonomous deterrence units.
How to Match a Delivery Model to Your Operating Profile
No single model is universally right. A specialty jewelry store with one high-value location and an existing on-site security manager has different needs than a 400-location auto parts chain with no overnight staff at any property. A small regional tire chain with five locations has different needs from either. The framework matters more than the answer.
The questions that actually decide the choice:
Portfolio scope: How many sites does the operator run, and what is the perimeter geometry at each?
After-hours accountability: Who is responsible for acting on a detected event at 2 AM on a Tuesday in February, and what does that person actually do?
Dispatch reality: What happens when the dispatch center treats an alert as low priority?
Prevention vs. documentation: What does last year’s data say about how often each delivery model produced an actual stopped incident, as opposed to a recorded one?
AI vs. human preference: Does the operator want AI to handle the bulk of the verification work, with human specialists reserved for persistent threats, or do they want a human operator on every event from the first frame?
The next section translates these questions into a five-question diagnostic that can be run against any property or portfolio in under an hour.
Ready to model the financial comparison for your properties?
The Virtual Perimeter Guard ROI Calculator estimates per-location annual savings from current incident frequency, guard cost, and loitering exposure.
A Five Question Diagnostic to Map Perimeter Risk to Solution
The framework and the model comparison are useful, but they do not, on their own, tell an operator what to do about their actual properties. The diagnostic below is designed to close that gap. It can be run on a single site or a portfolio, takes under an hour to complete with the right people in the room, and produces a defensible read on where the perimeter risk actually lives and which delivery model is likely to address it.
The five questions are sequential. Each one builds on the answer to the last.
1. When Does Perimeter Risk Actually Peak at Your Properties?
Most operators assume their highest-risk window is the middle of the night. The data tells a more specific story.
188 incidents the day before MLK Day. 9 incidents on Christmas Day.
The day before a holiday averaged 148 incidents per day, more than a regular operating day (146) and substantially more than the holiday itself (138). Perimeter risk concentrates on pre-holiday closings, not the holidays themselves.
Source: Interface Systems, 2026 Retail Loss Prevention Benchmark Report ²
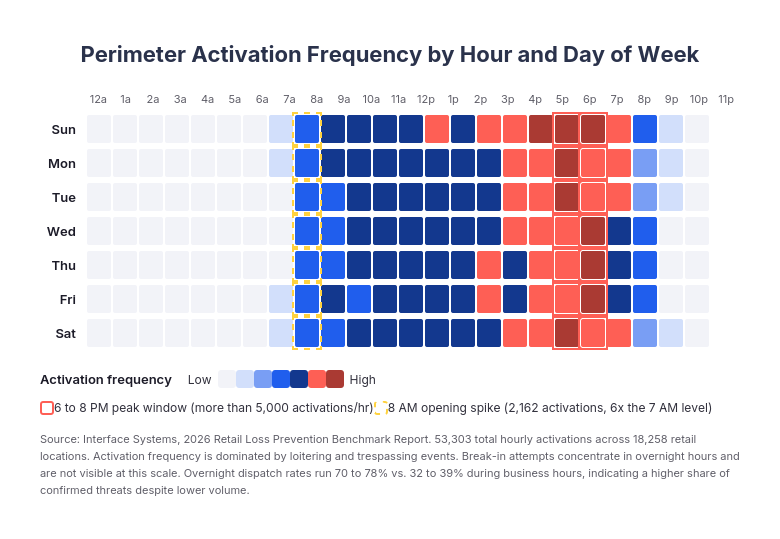
363% spike at store opening. Peak window: 6 PM to 8 PM.
Across 18,258 retail locations in 2025, incidents rose at 8 AM, sustained through the afternoon, and peaked sharply between 6 PM and 8 PM. Sundays and Mondays accounted for thirty percent of weekly incident volume.
Source: Interface Systems, 2026 Retail Loss Prevention Benchmark Report ²
What to do with this question: Pull twelve months of incident data from any source available, including alarm activations, camera reviews, police reports, and insurance claims. Map them by hour, day of week, and pre-holiday status. The pattern that emerges is the operator’s actual risk geometry in time.
2. Where Does Perimeter Risk Concentrate Geographically on the Property?
Perimeter is not a single line. It is a set of zones, each with different exposure depending on what the property does and who passes through it. A quick-service restaurant has a drive-thru lane, a parking lot, a rear delivery dock, and a dumpster enclosure. A tire shop has a fenced inventory yard. A car wash has a tunnel and pay stations. A big-box retailer has loading docks, a customer parking lot, and a rear receiving area. Each zone carries different incident frequencies and different intervention requirements.
What to do with this question: Walk the perimeter of one representative property at the hour the data says risk peaks. Note which zones are visible to the public, which are illuminated, which have camera coverage, and which can be approached without crossing any monitored boundary. The zones that fail all four checks are the perimeter risk concentration points, and they are usually not where the existing security investment is pointed.
3. What Is the Operator’s Current Detection-to-Intervention Time?
This is the hardest question to answer honestly because most operators have never measured it. The question is: when an actual perimeter event happens, how long does it take from the moment something detectable occurs until something on the property changes the situation?
For an alarm-only model, the answer is typically thirty to ninety minutes if police respond at all. For a camera-only model with phone alerts, the answer is whatever time elapses between the alert and a property manager waking up, looking at the clip, deciding whether to call police, and police arriving. For a guard patrol covering eight sites, the answer is the worst case in the rotation. For an AI-enabled autonomous system, the answer is seconds. For a live-monitored system with operators on duty, the answer is typically under sixty seconds for verification, plus police response time for dispatch events.
What to do with this question: Take three actual incidents from the past twelve months. For each, reconstruct the timeline from first detection to first action that changed the situation. The number that emerges is the operator’s real detection-to-intervention time. Most operators are surprised by it.
4. Who Is Accountable for Acting on a Detected Event?
This question often produces the longest silence in the room. In many operations, the answer is unclear. A district manager is on the call list but not actively monitored. A regional loss prevention contact is technically responsible but is asleep at 2 AM. The alarm panel calls the property contact, who lets it go to voicemail.
The accountability question matters because every delivery model routes the response somewhere, and somewhere needs to be a person or system that can actually act within the time window the threat allows.
What to do with this question: Name the specific human or system that is accountable for response at each property, by hour. If the answer is “the alarm company calls a list,” the diagnostic is complete: the operator is running an alarm-only model regardless of what other equipment is on the property, because no one has been assigned to do anything else.
5. What Is Your Tolerance for False Alarm and False Dispatch Costs?
This question often gets skipped because false alarms feel like a technology problem, not a business decision. They are a business decision.
95% of alarm events resolved as false alarms through video verification across 1.6 million monitoring events at 18,258 retail locations in 2025. The fines, the eroded police priority, the staff time spent responding to non-events, and the reputational cost with local dispatch centers all sit on the operator’s side of the ledger.
Source: Interface Systems, 2026 Retail Loss Prevention Benchmark Report ²
The model the operator chooses determines who absorbs this cost. Alarm-only and camera-only models push false-alarm filtering to the property contact or the dispatch center, neither of which can do it well. AI-enabled autonomous deterrence and remote video monitoring with live specialists both filter at the source, which is why their actual police dispatch rates run below one percent.²
What to do with this question: Pull twelve months of false alarm fines, false dispatch incidents, and any documented police priority changes for the operator’s properties. The number is usually larger than expected and is the most underweighted line in the perimeter security budget.
Want this guide in a format you can share with your team?
Download the PDF version of the Perimeter Security Buyer’s Guide, including the complete five-question diagnostic worksheet and delivery model comparison table.
Before You Run an RFP: Why Most Perimeter Security Procurement Processes Get the Wrong Answer
Once an operator has worked through the framework, the comparison, and the diagnostic, the question shifts from what kind of perimeter security do we need to which vendor should we actually buy from. That shift introduces a different set of problems.
Realistic Deployment Timeline for Perimeter Security Solutions
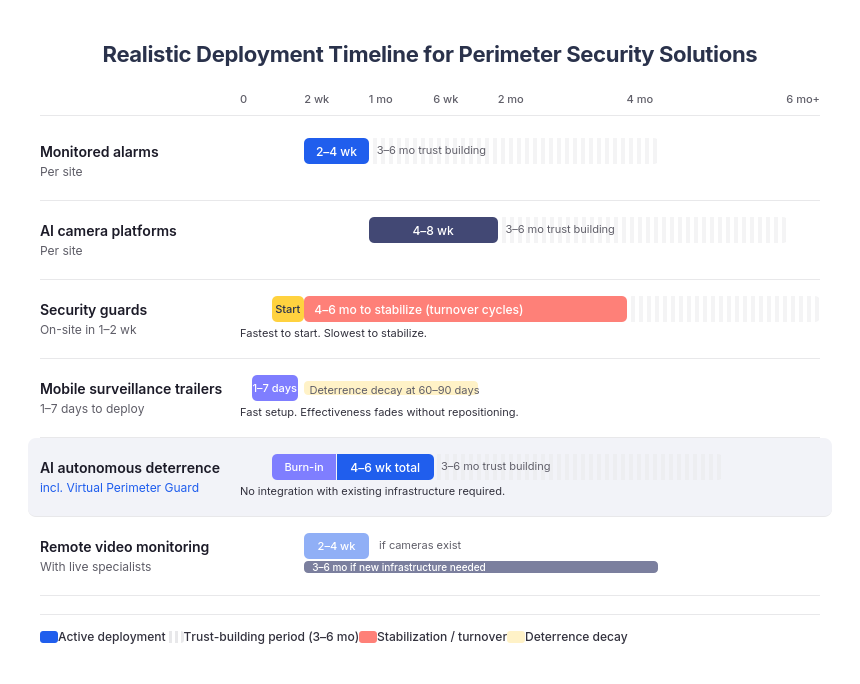
The gap between signing a contract and having a working perimeter security system is where many programs lose their first six months. The timelines below are realistic ranges for each delivery model, drawn from how these deployments actually run rather than how vendor proposals describe them.
Monitored Alarm Systems
A new alarm install at a single commercial property typically takes two to four weeks from contract signing to active monitoring. The work is mostly site visits, panel installation, sensor placement, and central station programming. For a multi-site rollout, a competent installer can deploy ten to twenty sites per month per crew, which means a 200-location chain runs ten to twenty months end to end depending on crew capacity.
The thing buyers underestimate: the central station programming and the property contact list. Sites go live with outdated emergency contact information remarkably often, which creates a false sense of coverage. Build a verification step into the rollout that confirms each site’s call tree is current before the alarm is treated as active.
AI Camera Platforms
A camera platform deployment runs four to eight weeks per site, longer for sites that need new cabling, network infrastructure, or power runs. The configuration work matters more than the install. Detection rules, zone definitions, alert thresholds, and integration with the operator’s Video Management Systems all require setup that typically continues for thirty to sixty days after the cameras come online.
For multi-site operators, the realistic full-portfolio timeline is six to eighteen months depending on site complexity and how standardized the perimeter geometry is across locations. Sites with consistent layouts deploy faster. Sites that all look different take longer than the proposal estimated.
Security Guards
Guard programs are the fastest to start and the slowest to stabilize. A guarding firm can have an officer on site within one to two weeks of contract signing, but the operational reality is that the same firm will likely cycle through three to five different officers at that site over the first six months. Each new officer needs to be briefed on property-specific protocols, customer interactions, and incident reporting. The “fully implemented” point for a guard program is usually four to six months in, when the rotation has stabilized and the firm has identified officers who fit the property.
Mobile Surveillance Trailers
One to seven days from order to on-site deployment. Setup takes under 30 minutes once the trailer arrives. The speed advantage is real but the timeline that matters is longer: most operators report that deterrence effectiveness holds for thirty to sixty days before decay sets in, requiring repositioning or escalation to a monitored configuration. For multi-site operators cycling trailers across a portfolio, build a rotation schedule into the deployment plan rather than treating each placement as permanent.
AI-Enabled Autonomous Perimeter Deterrence
Standalone AI-enabled units deploy in four to six weeks from signed agreement to live monitoring. The first two weeks include solutions engineering scoping, custom detection zone design, professional installation, and a burn-in period during which the system logs detections silently while the team tunes sensitivity and confirms coverage. Live monitoring begins immediately after burn-in.
Because each unit is self-contained with built-in cellular connectivity, deployment does not require integration with existing camera, network, or alarm infrastructure. The constraint on portfolio rollout is field technician availability and site survey scheduling rather than network or hardware integration work.
Remote Video Monitoring with Live Specialists
Live monitoring deployments are the most variable in timeline because the speed depends on the state of the property’s existing camera and audio infrastructure. Properties that already have compatible cameras and on-site speakers can be added to a monitoring service in two to four weeks. Properties that need new cameras, audio hardware, or network upgrades to support live streaming can take three to six months per site.
Multi-site rollouts of live monitoring typically run six to eighteen months and depend heavily on the operator’s appetite for standardizing camera infrastructure across the portfolio.
The Hidden Second Timeline: From Go-Live to System Trust
Every model has a hidden second timeline: the time from system active to system actually trusted by the operations team to the point where it changes behavior. That second timeline is usually three to six months regardless of model. Loss prevention teams need to see the new system handle real events, observe the false-alarm rate stabilize, and develop confidence in the response patterns before they will rely on it for staffing decisions, incident response protocols, or insurance discussions.
The implication for buyers: build that second timeline into the rollout plan rather than assuming the system delivers ROI from the day the green light comes on. The fastest model to deploy is not always the fastest model to start producing measurable risk reduction. The model that fits the operator’s actual operating context is.
How to Calculate Perimeter Security ROI: A Three-Layer Model That Survives CFO Review
ROI on perimeter security is harder to measure than on most commercial investments because the return is partly the absence of incidents that would have happened. An operator never gets to run the counterfactual. The site that did not get broken into this year may have been protected by the new system, or the burglary ring may have moved to a different chain, or the neighborhood may have changed. Honest ROI measurement requires a structure that accommodates this uncertainty rather than pretending it does not exist.
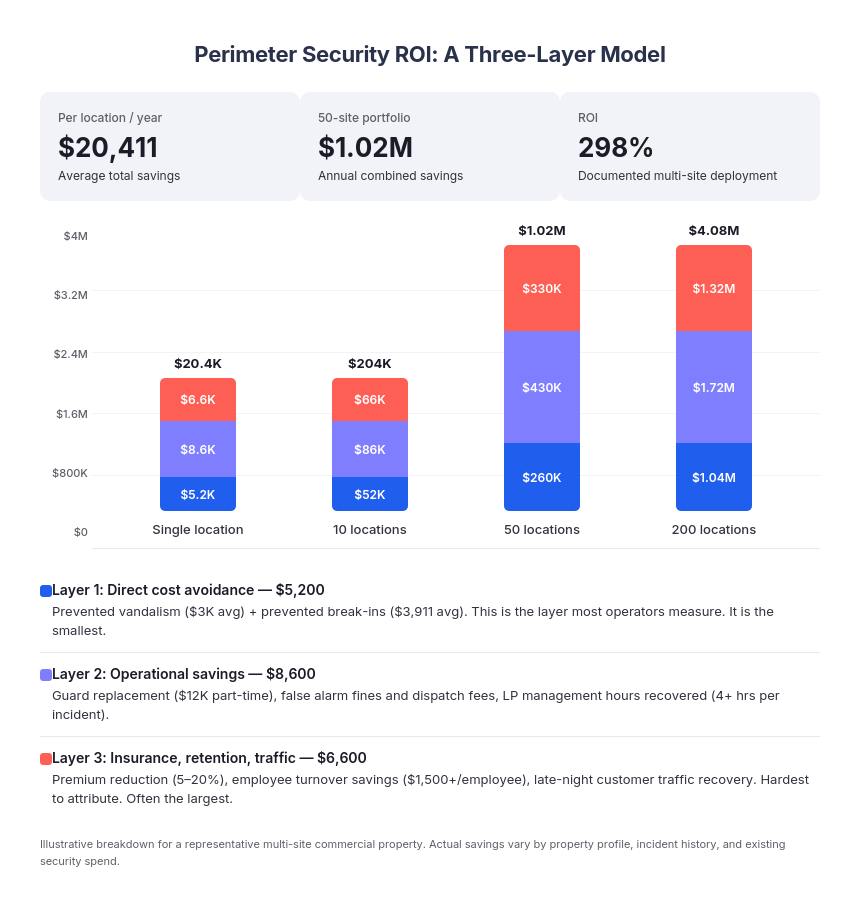
The framework below has three layers: direct cost avoidance, operational savings, and second-order effects. Most operators stop at the first layer. The second and third are usually larger.
Layer 1: Direct Cost Avoidance from Prevented Incidents
The first ROI layer is the dollar value of incidents the system prevents. Every operator has a per-incident cost they can pull from twelve months of insurance claims, repair invoices, and lost-revenue reports.
A single vandalism incident typically costs three thousand dollars or more in repair costs and lost revenue. A break-in averages $3,911 when factoring in repairs, downtime, and the deductible portion of the insurance claim that does not get reimbursed.³ Big Brand Tire documented fifteen thousand dollars per single break-in before deploying perimeter protection.³
The math for direct cost avoidance is straightforward: incident frequency times incident cost times the system’s prevention rate. A property running three vandalism incidents and one break-in per year, at typical cost, carries roughly thirteen thousand dollars in annual perimeter-loss exposure before any prevention.
Layer 2: Operational Savings from Replacing the Current Security Spend
The second ROI layer is the cost of the security model the operator is currently running, much of which the new system replaces. This is the layer most ROI calculations underweight.
A continuous on-site guard runs $50,000 to $100,000 per location per year, depending on coverage hours and regional labor rates.³ A part-time guard for loitering coverage during high-risk windows runs roughly twelve thousand dollars per year per location. False alarm fines, escalating dispatch fees, and the staff time required to respond to non-events add another four-figure annual cost at most multi-site operators, frequently underreported because the line items are scattered across regional budgets.
Loss prevention turnover and incident management time also belong in this layer. A single perimeter incident typically consumes four or more hours of management time in police reports, insurance claims, cleanup coordination, employee conversations, and late-open recovery. Across a portfolio with even moderate incident frequency, this is hundreds of management hours annually that the security team did not budget for and rarely tracks.
Layer 3: Insurance, Retention, and Customer-Traffic Effects
The third ROI layer is the effects that show up in operational metrics outside the security budget. These are the hardest to attribute and often the largest in dollar terms.
Insurance premiums: Retail and commercial property premiums rose 15 to 25 percent in 2024 alone, driven by rising claim frequency, fraud, and loss severity.⁴ Most operators absorb the increase. The ones who push back have one thing in common: professionally deployed video with verified monitoring and a documented record to show their insurer.
The evidence supporting insurance reduction is substantial. A three-year Zurich North America study across nine New York construction sites equipped with monitored video found a 50 percent reduction in workers’ compensation claim frequency compared to twelve control sites, with one site (Posillico Inc.) reducing its experience modification rate from 0.65 to 0.25, a direct premium reduction.⁵ Zurich now mandates video surveillance on every construction wrap-up project it insures in New York.⁵
Retail evidence is similar. CEC Entertainment, the operator of more than 510 Chuck E. Cheese locations, documented $600,000 in claims cost reduction over four years after deploying video surveillance, with multiple fraudulent claims eliminated after video footage surfaced contradicting them.⁶ The Insurance Information Institute and Electronic Security Association report that operators with installed video plus alarm systems typically negotiate annual premium reductions in the five to twenty percent range.⁷
The pattern is consistent: insurers reward documented, verifiable security investment because it changes their actuarial expectation of the property’s risk profile. Operators who deploy a perimeter system without preparing the documentation to bring to their carrier are leaving the largest ROI lever in the model on the table.
Employee retention: Front-line employees in unstaffed evening operations consistently cite safety concerns as a top driver of attrition. The benchmark report’s data on employee assistance request patterns shows that demand for monitoring and intervention peaks during opening, closing, and shift-change windows, the exact periods when employees feel most exposed.² Operators who deploy perimeter and intervention systems that demonstrably respond at those windows report measurable reductions in turnover at affected locations. At industry-average turnover replacement costs of $1,500 or more per employee, the math compounds quickly.
Late-night customer traffic: Properties with chronic loitering or perceived safety issues lose late-night customers who choose alternatives. White Castle’s deployment at a high-risk St. Louis location restored late-night customer traffic after loitering was eliminated.³
How the Three Layers Add Up: A Realistic Total
$20,411 average savings per location per year
Combined savings across vandalism, loitering, break-in, and employee turnover costs. Big Brand Tire documented 298% ROI and zero break-ins after deployment, with a 65% reduction in security activations within weeks.
Source: Interface Systems, Virtual Perimeter Guard ROI Calculator ³
For an operator running a 50-location portfolio, that scales to roughly one million dollars per year in combined direct and operational savings before insurance and turnover effects are factored in. The numbers vary by property profile, incident history, and existing security spend. The framework does not. An operator who measures only Layer 1 will systematically understate the return. An operator who measures all three will produce a defensible business case that survives CFO review.
Six Metrics to Track During Your First 90 Days
Most ROI claims for perimeter security systems are made before the system has been deployed long enough to validate them. The discipline that separates a real ROI measurement from a marketing claim is what gets tracked during the first 90 days. The six metrics that actually matter:
- Total system activations by site and by hour of day: This establishes the operational baseline and reveals whether the system is detecting at the volume the property’s risk profile predicts.
- Percentage of activations resolved without human escalation: This measures the autonomous deterrence rate and determines how much of the workload the AI layer is handling before a specialist is needed.
- Percentage of escalated events resolved without police dispatch: This measures the live intervention model’s effectiveness and is the number that determines whether the system is producing outcomes police departments will trust.
- Number of confirmed incidents that occurred despite system activation: This is the only honest measure of prevention failure, and the one most vendors will not volunteer.
- Change in false alarm dispatches and associated fines: Compare to the prior 90-day period. This number is the fastest ROI indicator because the savings are immediate and measurable.
- Change in loss prevention management hours spent on perimeter incidents: At four or more hours per incident, this is the hidden labor cost that rarely appears in the security budget but always appears in the LP team’s calendar.
These six metrics, tracked weekly, produce a defensible read on whether the system is delivering the return the proposal promised. Operators who run a structured pilot period before scaling tend to land at numbers closer to the documented case studies than operators who deploy and measure simultaneously.
Ready to see what this looks like at your properties?
Schedule a free Perimeter Risk Review to get a property-level assessment, recommended deterrence zones, and an ROI comparison against your current security spend.
Next Steps: Run the Diagnostic, Test the Model, or Calculate Your Savings
Three next steps, depending on where the operator is in their process:
For operators still mapping their own perimeter risk: Run the five-question diagnostic from the diagnostic section against one representative property. The pattern that emerges decides everything else.
For operators who already know the gap and want to talk specifics: Schedule a free Perimeter Risk Review. In a 20-to-30-minute session, Interface’s team will assess your property layout, recommend deterrence zones, and provide an ROI comparison against your current security spend.
For operators ready to model the savings: The Virtual Perimeter Guard ROI Calculator estimates per-location annual savings from current incident frequency, guard cost, and loitering exposure.
Download the PDF version of this guide to share with your team. The PDF includes the complete five-question diagnostic, the delivery model comparison table, and the three-layer ROI framework in a format ready for internal distribution.
The framework in this guide is vendor-neutral. The next steps above are not. Operators evaluating the broader category should also see How to Choose a Perimeter Security System for Commercial Properties for the procurement workflow, and The Perimeter Security RFP Teardown for an analysis of what 50 real procurement documents reveal about how buyers get this decision wrong. All pieces link to the Virtual Perimeter Guard service page.
References
All claims, statistics, and quoted figures in this guide are anchored to the sources below. The reference list is grouped by source and numbered to match the inline footnotes throughout the guide.
- Council on Criminal Justice, Burglar Alarms issue paper. Source for the one-to-five-percent false alarm rate, burglary duration figures (eight to ten minutes), and the Salt Lake City and Milwaukee verified-response data. Published by the Safety Reimagined initiative. safetyreimagined.org/papers/burglar-alarms
- Interface Systems, 2026 Retail Loss Prevention Benchmark Report. Source for all retail-wide performance data: 1.6 million monitoring events, 18,258 retail locations, 0.38 percent dispatch rate, 99.7 percent voice-down resolution, 95 percent false-alarm resolution rate, the time-of-day and day-of-week incident patterns, and the pre-holiday risk findings. Also the source for the Q4 2025 Virtual Perimeter Guard deployment data: 29 retail locations, 23,810 activations, 96.1 percent automated resolution. interfacesystems.com/2026-benchmark-report
- Interface Systems, Virtual Perimeter Guard product page and ROI calculator. Source for typical cost positioning, deployment timeline, the Big Brand Tire ROI numbers (298 percent ROI, 65 percent reduction in security activations, zero break-ins after deployment), the White Castle deployment outcome, the per-incident cost ranges, and the $20,411 per location annual savings figure. interfacesystems.com/virtual-perimeter-guard and ROI Calculator
- 2024 commercial property premium increase data. Source for the 15 to 25 percent rise in retail and commercial property insurance premiums in 2024. Cited via Interface Systems, Video Security ROI: Insurance Claim Reduction asset.
- Zurich North America and Arrowsight three-year construction site study. Source for the 50 percent workers’ compensation claim frequency reduction across nine New York construction sites versus twelve control sites, the Posillico Inc. experience modification rate reduction (0.65 to 0.25), and the Zurich mandate on construction wrap-up project video surveillance. https://www.zurichresilience.com/knowledge-and-insights-hub/articles/2025/11/leading-the-way-breakthroughs-in-construction-safety
- CEC Entertainment (Chuck E. Cheese), reported by Workforce.com. Source for the $600,000 in claims cost reduction over four years across more than 510 locations, and the elimination of multiple fraudulent claims through video footage.
- Electronic Security Association and Insurance Information Institute. Source for the 5 to 20 percent annual premium reduction range for properties with installed video plus alarm systems.