RESEARCH REPORT
Three threats drive 88% of retail security incidents
Most LP teams build security programs around assumptions, not data
Retail shrink continues to rise. Budgets are under pressure. And most loss prevention teams lack the operational data to know exactly when, where, and how risk concentrates across their locations. This report changes that.
53,369
High-priority security events analyzed
88%+
Of threats come from just three categories
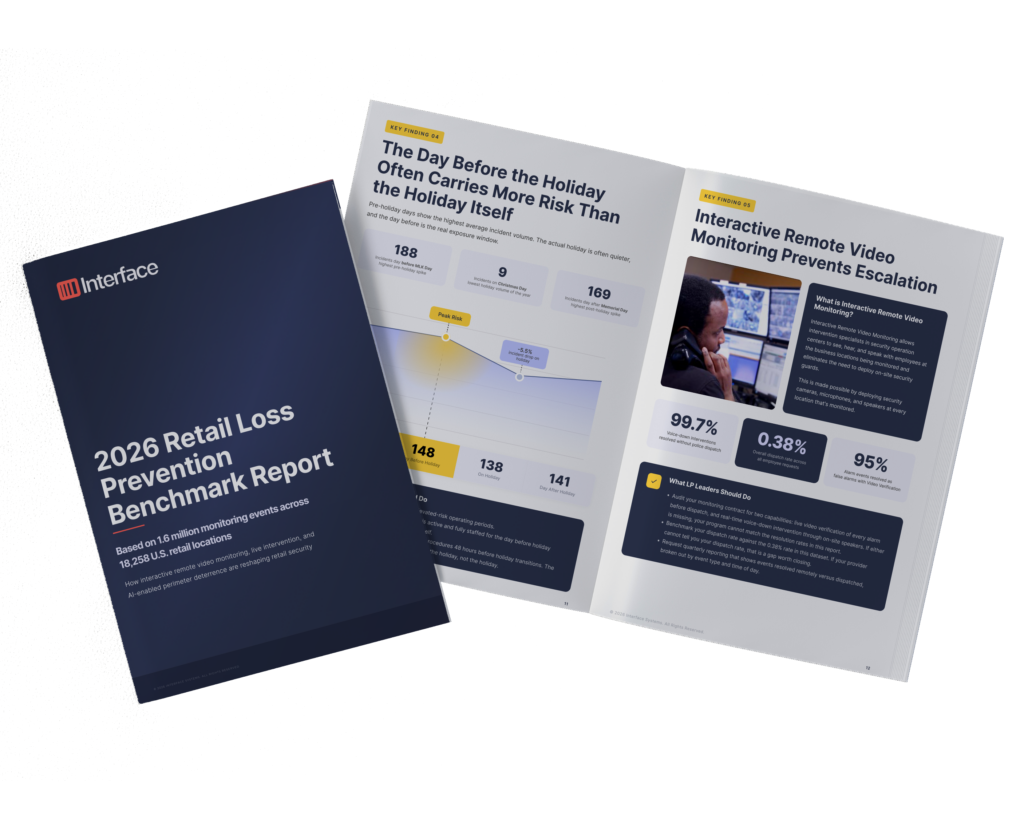
6-8 PM
Peak escalation window across all locations
Key findings from the report
Each finding is backed by real operational data from monitored retail locations, not survey responses. Here is a preview of what the full report covers.
363%
Built for retail loss prevention professionals
Benchmark your program against real operational data from 18,258 locations
District and Regional Managers
Align staffing and monitoring coverage to actual risk patterns by daypart and day of week
Security Operations Leaders
Evaluate interactive monitoring, video verification, and perimeter deterrence with real performance data
How interactive monitoring changes outcomes
Interface Systems combines AI-powered technologies with expert remote video monitoring by trained intervention specialists from its U.S.-based Interactive Security Operations Centers (iSOCs).
99.7%
95%
96.1%
VIRTUAL PERIMETER GUARD: 23, 810 ACTIVATIONS

Real operational data, not survey responses
Each finding is backed by real operational data from monitored retail locations, not survey responses. Here is a preview of what the full report covers.
This report draws on anonymized operational data from Interface Systems’ Interactive Security Operations Centers (iSOCs), covering January through December 2025. The dataset includes 1.6 million monitoring events, 53,369 high-priority security events, 18,258 U.S. retail locations, and 51 distinct retail brands. High-priority events cover criminal activity, disruptive activity, and emergency response. Routine events such as video tours, false alarms, and system health checks are excluded from the high-priority analysis.