



3% of restaurant locations drive 81% of serious security events
The 2026 Restaurant Security Impact Report analyzes 1.1 million monitoring events across 9,392 U.S. restaurant locations and 78 brands to reveal where risk concentrates, when it peaks, and what stops it before police are called.
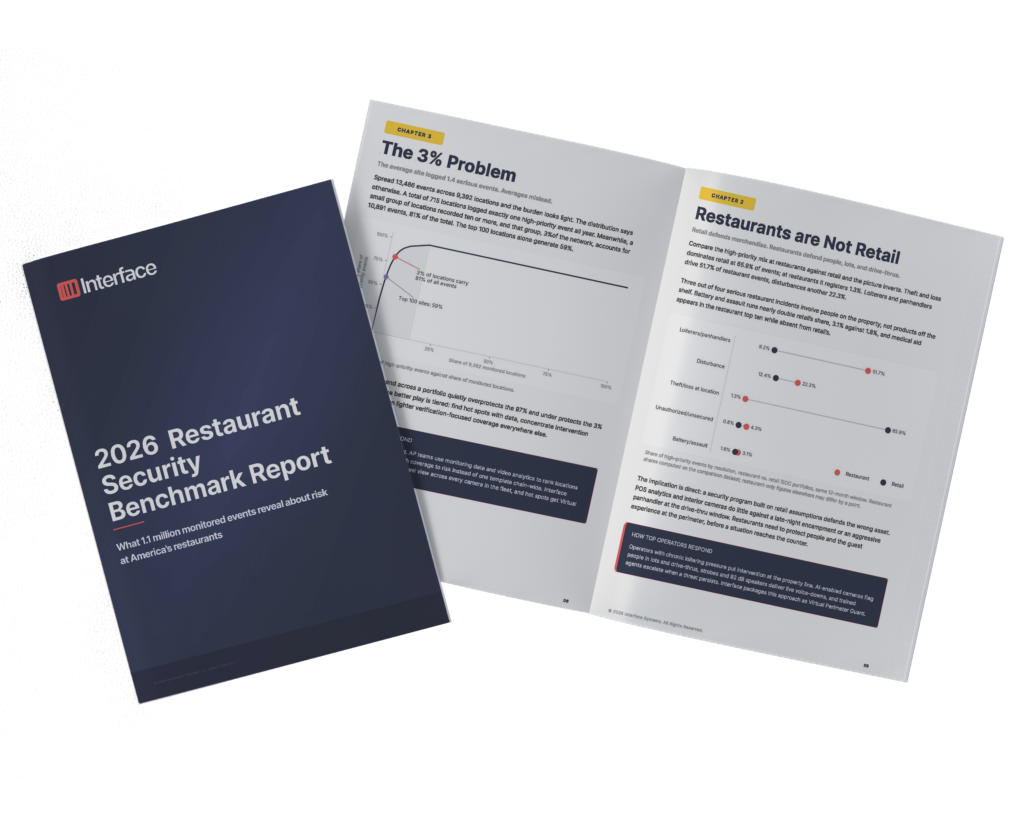
Restaurant risk is not spread evenly
Across 9,392 locations, serious security events cluster in a small share of sites, concentrate in specific hours, and follow seasonal patterns. The data shows where risk actually sits, so security effort can follow the risk instead of being applied the same way everywhere.13,486
High-priority security events analyzed
74%
Of threats come from just three categories
6 PM
Peak escalation window across all locations
Key findings from the report
Each finding is backed by real operational data from monitored restaurant locations, not survey responses. Here is a preview of what the full report covers.81%
98.4%
44%
225
61%
Built for retail loss prevention professionals
Benchmark your program against real operational data from 9,392 locations
Align monitoring coverage to actual risk patterns by daypart, day of week, and location
See where security spend reduces risk fastest across a growing portfolio
How interactive monitoring changes outcomes
Interface Systems combines AI-powered technologies with expert remote video monitoring by trained intervention specialists from its U.S.-based Interactive Security Operations Centers (iSOCs). .98.4%
Events resolved without dispatch
97%+
False alarms cleared by video verification
225/day
Staff assistance requests answered
Real operational data, not survey responses
This report draws on anonymized operational data from Interface Systems’ iSOCs, covering June 2025 through May 2026. The dataset includes 1.1 million monitoring events, 13,486 high-priority security events, 9,392 U.S. restaurant locations, and 78 distinct restaurant brands. High-priority events cover criminal activity, disruptive activity, and emergency response. Routine events such as video tours, false alarms, and system health checks are excluded from the high-priority analysis.
