Crime now starts at the curb. To understand the risks retailers face in securing their storefronts and perimeters, Interface Systems reviewed public news reports from May 1, 2024, to April 30, 2025, and verified 85 perimeter attacks across 12 states. Our research uncovered the following:
- 31 Smash-and-grab or flash-mob events
- 13 Vehicle-ram burglaries
- 11 Repeat hits within ninety days
- $22,000 - Average reported loss
The highest single loss approached $100,000 when nearly one hundred looters overran a liquor mini-mart in Oakland. Hill Boyz Wing & Burger Bar in Memphis lost $36,000 when vandals shattered every pane of glass before dawn. A variety of retail and restaurant establishments in downtown Tacoma, Washington, awoke to broken storefront windows in one night. On the West Coast, vehicle attacks continued: pickups breached doors in San Jose and Vallejo, while a three-station gas-station row in Oakland took successive hits the same weekend.
Smash-and-Grab, Vandalism & Loitering on the Rise
Retail shrink climbed to $112.1 billion in 2022, a nineteen-percent rise in a single year, according to the National Retail Security Survey. Flash mobs overwhelm convenience stores and supermarkets, grabbing liquor, cigarettes, and lottery tickets in under five minutes.
Vehicle-ram burglaries have become common on both coasts because a stolen sedan converts storefront glass into an instant doorway.
Police response times rarely match the speed of these crimes. Recent data from Dallas shows that priority-three calls, the bucket that includes most unverified alarms and loitering complaints, take over two hundred minutes for an officer to respond.
A 1997 U.S. Small Business Administration study estimated the typical repair bill after crime-related damage at $3,370. When adjusted for 25 years of inflation, that works out to roughly $6,500 in today’s dollars. Stores hit once are more than three times as likely to be hit again within ninety days, multiplying those costs.
Loitering is a silent problem with a real impact on retailers. San José’s (California) 2024 9-1-1 review shows “suspicious person, vehicle, or trespass” calls topping 15,000 events a year, accounting for more than 17 percent of all police dispatches. Dallas posts a similar pattern. Its June 2024 dashboard lists 12,178 suspicious-person calls in the first half of 2024, ranking the code fourth among every call type handled by 9-1-1. However, enforcement is lagging. FBI arrest tables show curfew-and-loitering arrests dropping from 73,670 in 2010 to 10,781 in 2019, an eighty-five percent fall. Law enforcement just doesn’t have the capacity to deal with the problem and leaves the onus of securing private property and places of business to individuals and commercial entities.
Understanding Commercial Vandalism and Loitering
Retailers face a diverse array of threats in securing the storefront and the perimeter.
However, retail and restaurant loss prevention teams often focus on securing what’s inside the “four walls” of an establishment, leaving the storefront and perimeter vulnerable.
A different way to look at this issue is to divide a store and its surroundings into zones that need security.


Our incident review shows Zone 4 is the weakest link. Lighting and basic CCTV exist, yet few retailers pair cameras with analytics or live response. Offenders exploit that blind spot to stage smash-and-grab raids or break windows for fast entry, and vandalism or loitering is rampant.
What the Data Shows - Five Perimeter Attack Patterns
Our data spanning 85 incidents shows five types of attack patterns that loss prevention teams should watch out for:
1. Late-night glass breaks
Most stores close, lights dim, and staff head home after midnight. Attackers exploit that quiet window. As called out earlier, Memphis’s Hill Boyz Wing & Burger Bar lost $36,000 when vandals shattered its façade at 2 a.m., and Tacoma merchants arrived to find windows ruined before dawn. Darkness hides license plates, and empty streets give thieves the three to five minutes they need to clear shelves and escape.
2. Parking-lot flash mobs
Social channels and group texts let dozens converge in seconds, often on bikes or in multiple cars. In Oakland, nearly one hundred looters swarmed a 76 mini-mart, stripped merchandise, and vanished before the first cruiser rolled up. A similar crowd hit a Los Angeles 7-Eleven on Central Avenue, cycling off with snacks and vape pods before alarms could finish their cycle. Large numbers overwhelm lone clerks and confuse CCTV playback.
3. Repeat targeting
Criminals return when they know the response is slow or repairs are surface-level. Our log shows that eleven of eighty-five sites were hit a second time within ninety days. Berkeley’s Jaffa Coffee was vandalised four times in eight months, and a Lockport pizzeria replaced broken glass in April only to find fresh bricks through the door the next night. Offenders assume insurance delays and back-order parts keep stores vulnerable.
4. Vehicle ramming
Stolen pickups and sedans create instant doorways. Oakland saw a truck punch through a liquor store roll-up at 3 a.m. before thieves hauled cases to a waiting SUV. San Jose recorded a similar smash where a car reversed into display coolers and then fled with whiskey cartons. Glass-break sensors trip only after impact, giving crews the head start they need.
5. Graffiti as cover
Taggers or protest vandals draw staff outside, freeing partners to test locks and cameras. Manny’s Café in San Francisco found anti-Israel slogans on its walls while a side door’s deadbolt had tool marks. In Houston, four restaurants were splashed with red paint and political flyers; police suspect scouts checked alarm panels during the chaos. Graffiti also signals low risk, inviting more serious crimes later.
Why Standard Solutions Fall Short
Most loss prevention budgets go towards securing Zone 1 and Zone 2, the sales floor, cash wraps, offices, and stockrooms, because managers view those areas as closest to revenue. High-definition cameras, EAS gates, and POS analytics work well inside the four walls; however, our incident log shows that first contact with criminals now happens in Zone 4, the parking lot, and exterior approach lanes.
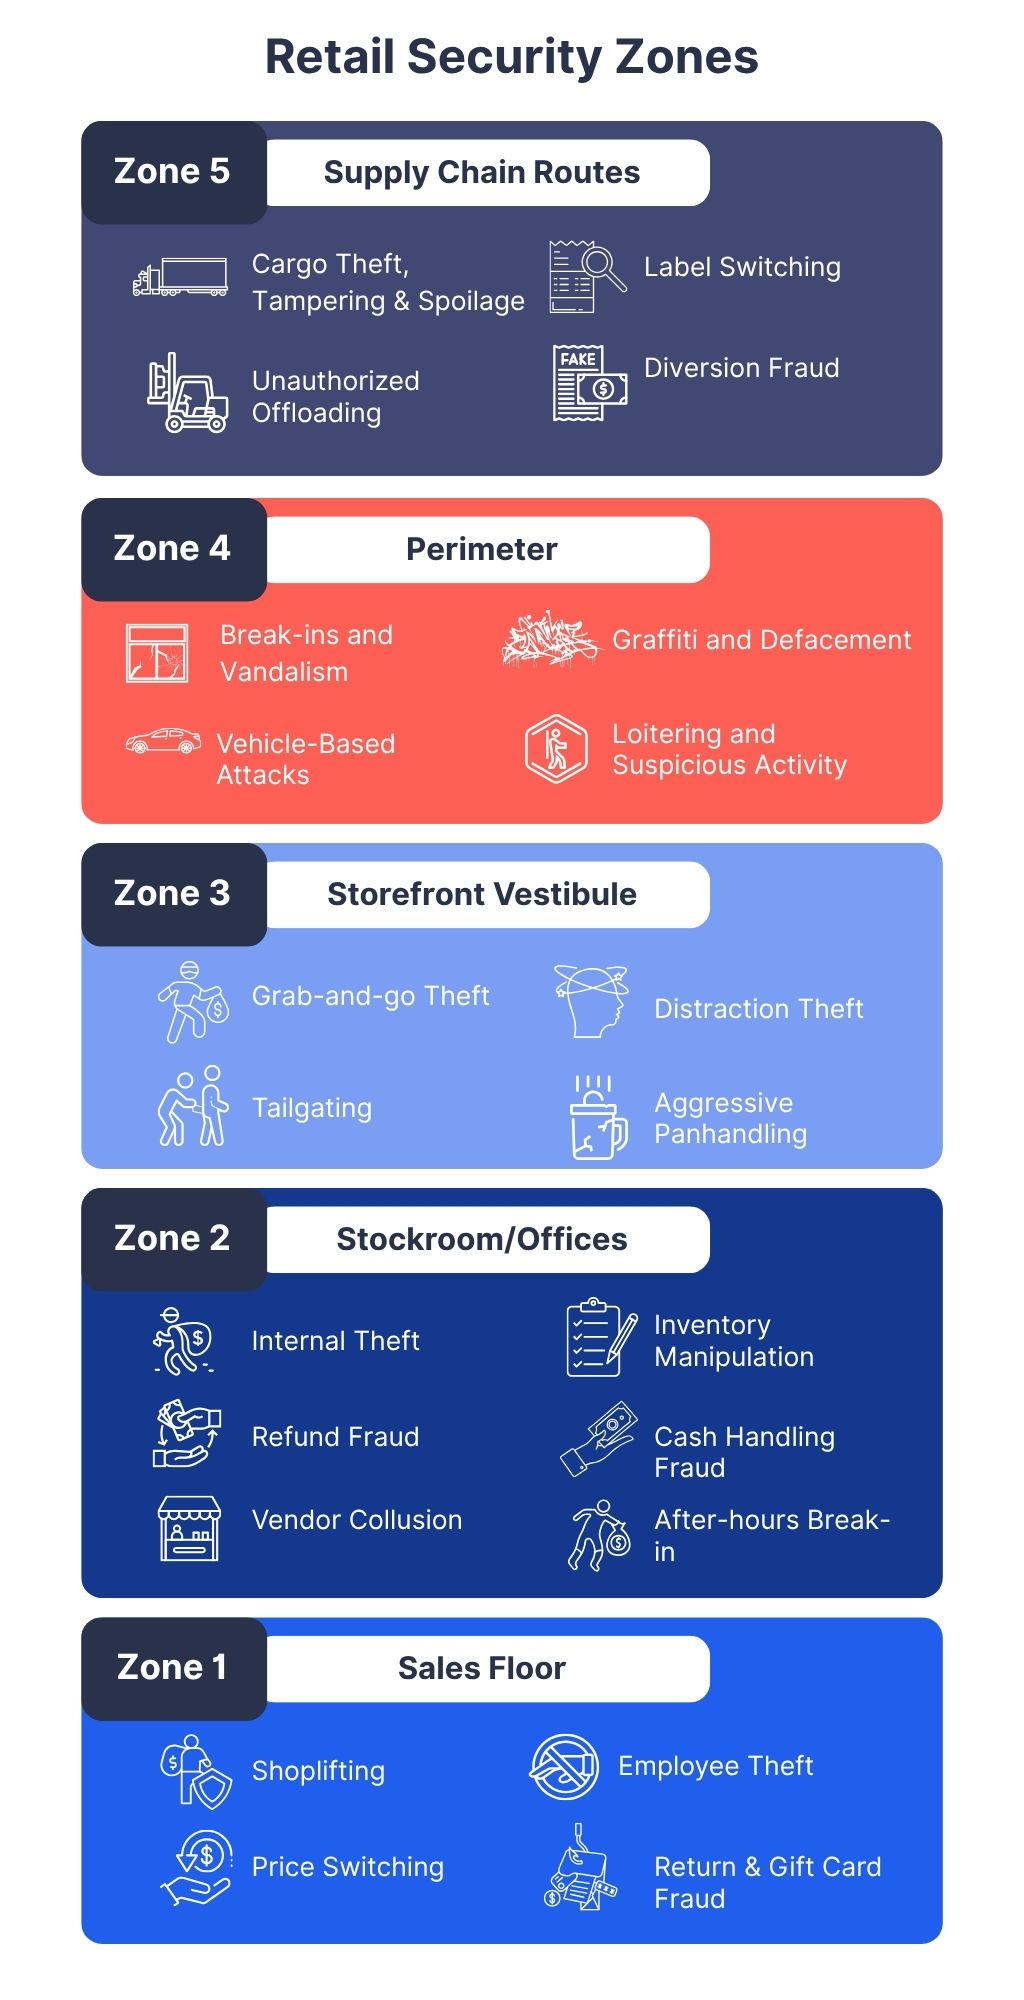
Zone 4 is usually covered only by static floodlights and basic CCTV. These tools cannot identify a loitering vehicle, track a crowd forming near storefront glass, or detect a pickup truck reversing toward a roll-up door. Without real-time detection and deterrence at the curb, every interior zone inherits the risk.
Standard defenses react after entry, giving criminals the two-minute window they need.
Virtual Perimeter Guard: Closing the Zone 4 Gap
Interface’s Virtual Perimeter Guard delivers proactive outdoor defence by combining AI detection, automated deterrence, and live human intervention.
Virtual Perimeter Guard extends Interface’s indoor Virtual Security Guard platform, giving retailers continuous coverage from curb to cash wrap.
By closing the Zone 4 gap with Virtual Perimeter Guard, retailers see real financial wins. False alarms fall by as much as ninety-five percent, eliminating municipal fines and freeing police for verified calls. A single prevented smash-and-grab saves roughly $10,000 to $30,000 in glass, labor, and lost trading hours. Remote monitoring reduces guard payroll while expanding coverage, and video-verified dispatches expedite insurance payouts and strengthen court cases, converting security expenditures into a measurable return.
Expanded Perimeter Hardening Plan
-
Map and Audit
Walk the lot at night and during the day. Flag dark corners, dumpster zones, and blind spots where cars can idle unseen. Verify that each camera captures faces and plates. -
Layered Detection
Install AI-enabled cameras trained for loitering, crowd density, and reverse-motion vehicles. Set dwell-time thresholds that alert staff when anyone lingers near doors or cash safes. -
Active Deterrence
Infrastructure Mount weather-rated speakers at main doors, alley gates, and loading docks. Calibrate strobe lights that trigger with analytic alerts. Record warnings that reference police notification to increase perceived risk. -
Live Intervention Protocols
Leverage Virtual Perimeter Guard for live human intervention for persistent threats via the interactive Security Operations Centers. Define a call tree so operators can verify with local managers before dispatching law enforcement if required. -
Continuous Optimization
Review Virtual Perimeter Guard reports to identify high-risk times and repeat crime patterns or locations. Adjust lighting angles based on incident reviews and seasonal spikes. Conduct semi-annual drills to test police response after a video-verified dispatch to ensure procedures stay current.
Data Sources
The retail perimeter-crime findings in this article are based exclusively on 85 public-domain incident reports collected between May 1, 2024, and April 30, 2025. Every row in the dataset points to one original, date-stamped URL. Each URL was verified as live and publicly viewable at the time of data collection. Below is a breakdown of the sources: